

Filtering Data
Data Discovery provides primary access to data filtering capabilities through the Query/Filter command. A double set of filters is provided for both rows and columns - which can be applied separately or in unison.
- The filtering function uses the dimensions already in the query selection:
- Those on the columns for rows.
- Those on the rows for columns.
- Any measure (independent of what was included in the query).
- The dual filters for each axis are designed to act in a nested fashion: the results of filter 1 are used as a source for filter 2.
- Each of the filters can support a variety of functions and can be used to select or deselect elements from the underlying query result set.
NOTE: Consumer users do not have access to Column filtering. However, they do have access to row filtering.
Multiple Mechanisms for Filtering
Users can filter data from a variety of points in the Data Discovery application:
- Quick Filtering - directly from the report component context menus. This applies a variety of simple "top" and "bottom" filters using the context of the current query result set.
- Standard Filtering - from the main filter dialogs in the Query ribbon tab. This offers users classic filter options using a dialog to make certain settings.
- Advanced Set Designer Filtering - from the advanced set designer ("ASD") wizard. The ASD wizard offers numerous advanced filtering capabilities that go well beyond the standard filtering options in the main application.
Classic Filter Functions
Each function requires the user to pick the "criteria field" - which is the current dimensional selection in either the relevant row or column that will be used to determine the metrics used in the filter. Independently, the functions also require the "criteria measure" - which is also independent of any measures already included in the current query.
Selecting and Deselecting Filtered Elements
Using the filters, the application will either select the elements with the chosen filter (removing the others from the source result set) or remove the filtered elements and returning the remaining elements in the result set.
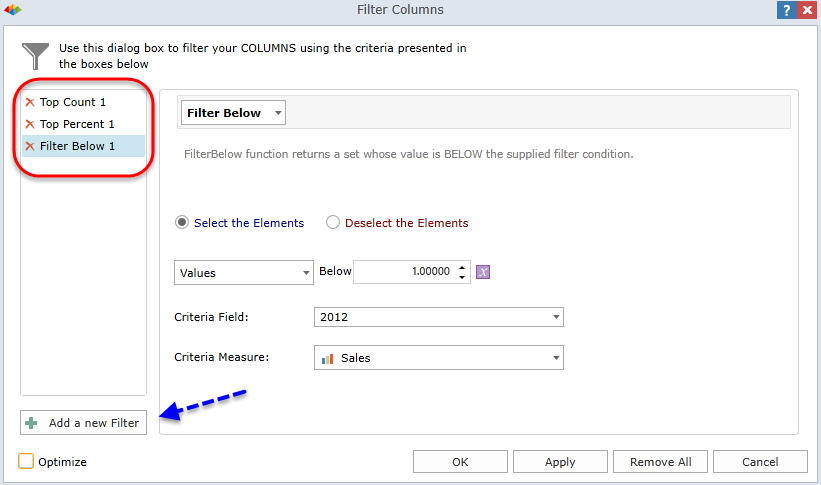
Multi-Filter
You have the ability to create multiple filters that will be nested within each other based on your selections.
Select "Add a new Filter" from the left-side panel in the Filter dialog box. Once you choose which filter to add, it will appear in the left-hand panel (outlined below in red). Click Apply to run.
Optimize
Check the Optimize box to improve filter processing time by checking first for empty cells and removing them from the query using the NONEMPTY Function. For details, read about query options.
NOTE: When Optimize is checked, the filter outcome might render unexpected results depending on the content of the data model. Therefore, the Optimize box should be used with care and results should be observed.
Home |
Table of Contents |
Index |
User Community
Pyramid Analytics © 2011-2022